| Prime Factors |
| Plotting the Prime Factor Frequencies |
Prime numbers and powers of prime numbers have exactly one prime factor. The smallest number with more than one prime factor is 6 = 2*3. 12 = (2^2)*3 also has exactly two prime factors. For a given range of numbers (e.g., 1 to 1,000,000) let NPF(n) denote the number of numbers with exactly n prime factors. When we consider the 29 integers from 2 through 30 we find that there are 16 which have exactly one prime factor, namely, the prime numbers from 2 to 29, 12 which have exactly two prime factors, namely, 6 = 2*3, 10 = 2*5, 12 = 22*3, 14 = 2*7, 15 = 3*5, 18 = 2*32, 20 =22*5, 21 = 3*7, 22 = 2*11, 24 = 23*3, 26 = 2*13 and 28 = 22*7; and 1 which has exactly three prime factors, namely 30 = 2*3*5.
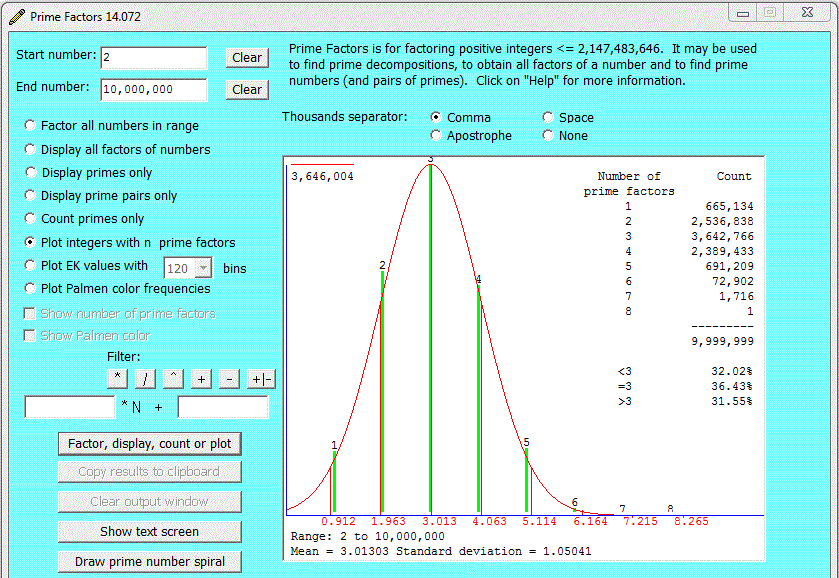
The Prime Factors program allows us to consider the question, Is there any regularity or pattern to the numbers NPF(1), NPF(2), NPF(3), ... Consider, for example, the range of integers from 2 through 10,000,000. We can use Prime Factors to plot a histogram of the numbers of integers in this range, obtaining:

Clearly the counts tend to lie on the Gaussian curve defined by their mean and standard deviation. Since the prime numbers, when viewed as contained in the linear sequence of positive integers, appear to occur randomly, this lawfulness is quite astounding.
It might be thought that the limit of the mean is π (3.14159...), but if the program is run for many hours the mean increases gradually to beyond 3.147, disproving this hypothesis, and suggesting that the mean,
sum(i=2:n)[NPF(i)*i]
--------------------
sum(i=2:n)NPF(i)
The red Gaussian curve is defined by the mean and standard deviation of the calculated EK values, whereas the magenta Gaussian curve has a mean of 1/6 and a standard deviation of 2/3 (this seems to be, in some sense, the "ideal" for the distribution of EK values).
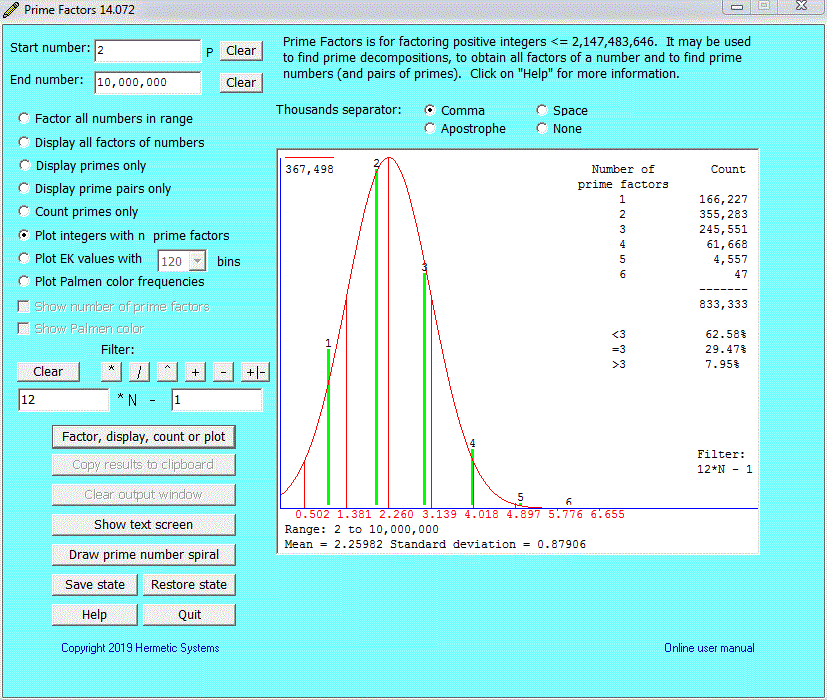
Curiously, the Gaussian property persists even with filters. For example, using the filter 12*N - 1 and plotting the integers with n prime factors over the range 10,000,000 to 10,100,000 we obtain:

How are these observations to be explained?
| Prime Factors | Home Page |