We begin with a grid in which about half of the locations are occupied by healthy cells. A healthy cell will occasionally divide, to produce two daughter cells. Cells are subject to a very low rate of infection by a virus (assumed to be lurking but not visible). Once a cell is infected the virus invades the cell's nucleus and takes control of the cell (which can no longer divide). The virus subverts the genetic replication process of the cell so that multiple copies of the virus are produced. After a certain period the cell dies, releasing these viral copies. Any neighboring cells are then usually, but not always, infected, and the process continues.
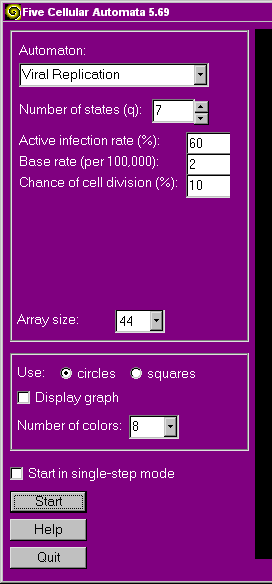
 The initial screen for the Viral Replication automaton has controls as shown at right:
Cells may be in any of q states. A cell which is healthy is in state q. A healthy cell is infected with a very low probability given by the "base rate" (e.g., 2 chances in 100,000, i.e., 0.002%). Upon initial infection a cell is in state q-1. Thereafter its state decreases steadily to state 1, at which point it ceases to exist and the replicated viruses are released, possibly infecting any cells occupying the eight immediately adjacent locations. The probability that a cell (healthy or infected) at a neighboring location will be (further) infected is given by the "active infection rate" (in percent). While all this is happening, a healthy cell which is not completely surrounded by other cells will divide into two cells with a probability given by the "chance of cell division" (in percent).
The rules for this automaton are given, more exactly, on the Algorithms page.
The system may sometimes consist entirely of healthy cells, but because of the non-zero base infection rate sooner or later an infected cell will appear, at which point the infection spreads. The system may sometimes consist entirely of infected cells, after which all cells soon disappear (the simulation actually stops if a stage is reached where all cells are infected, since then complete disappearance of cells is inevitable).
For a wide range of values of k1, k2 and k3 the number of cells oscillates between few and many. The higher the infection rates the more viruses will be produced and the more cells will be infected. The higher the chance of cell division the faster will the population of cells, depeted by viral infection, be replenished by healthy cells. The actual manner in which this oscillation occurs depends on the values of k1, k2 and k3.
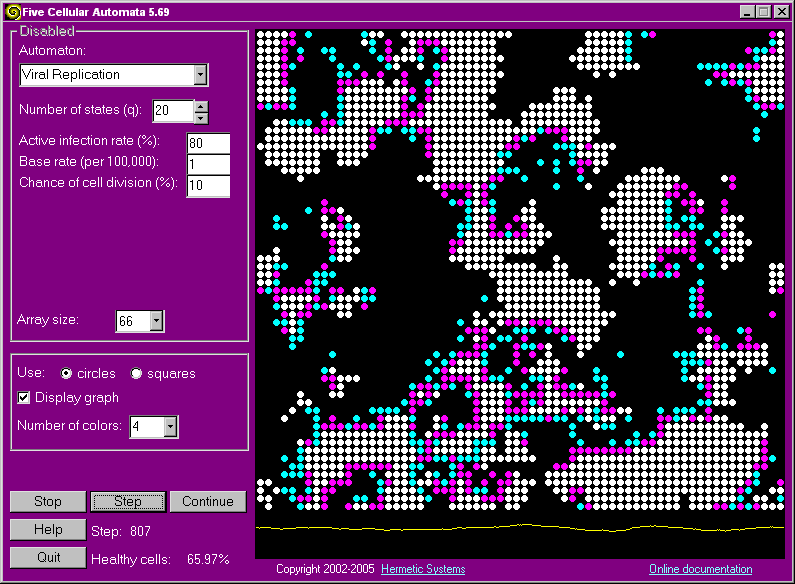
A healthy cell is colored white. The color of an infected cell depends on whether 1, 2, 4 or 8 colors have been selected. If a single color is used then the degree of infection of an infected cell is shown by the brightness of its color (cells in state q-1 are brightest, those in state 1 are darkest). If 8 colors are used then the degree of infection, from highest (1) to lowest (q-1) corresponds to this sequence of colors: blue, cyan, green, magenta, red, yellow. If q > 8 then each color represents a range of cell states.
Here's an example of what the system looks like after running awhile with the parameters set as shown. The magenta cells are those with early-stage infection and the cyan cells are those with late-stage infection.

| Next: Diffusion-Limited Aggregation | |
| Five Cellular Automata | |
| Hermetic Systems Home Page | |